# Visual Playground Life Sheet
All the code to visualize the FxLifeSheet data using [Plotly JS](https://plotly.com/javascript/)
## Dependencies
```sh
bundle install
```
Create a `.keys` file in the current directory with the following content
```sh
export DATABASE_URL="postgresql://[url]"
export DEFAULT_MIN_DATE="2019-04"
```
## Run server
```sh
source .keys
```
```sh
bundle exec ruby server.rb
```
## Run frontend
```sh
cd frontend && python -m SimpleHTTPServer
```
and open [http://127.0.0.1:8000/frontend.html](http://127.0.0.1:8000/frontend.html)
## Examples
### frontend.html
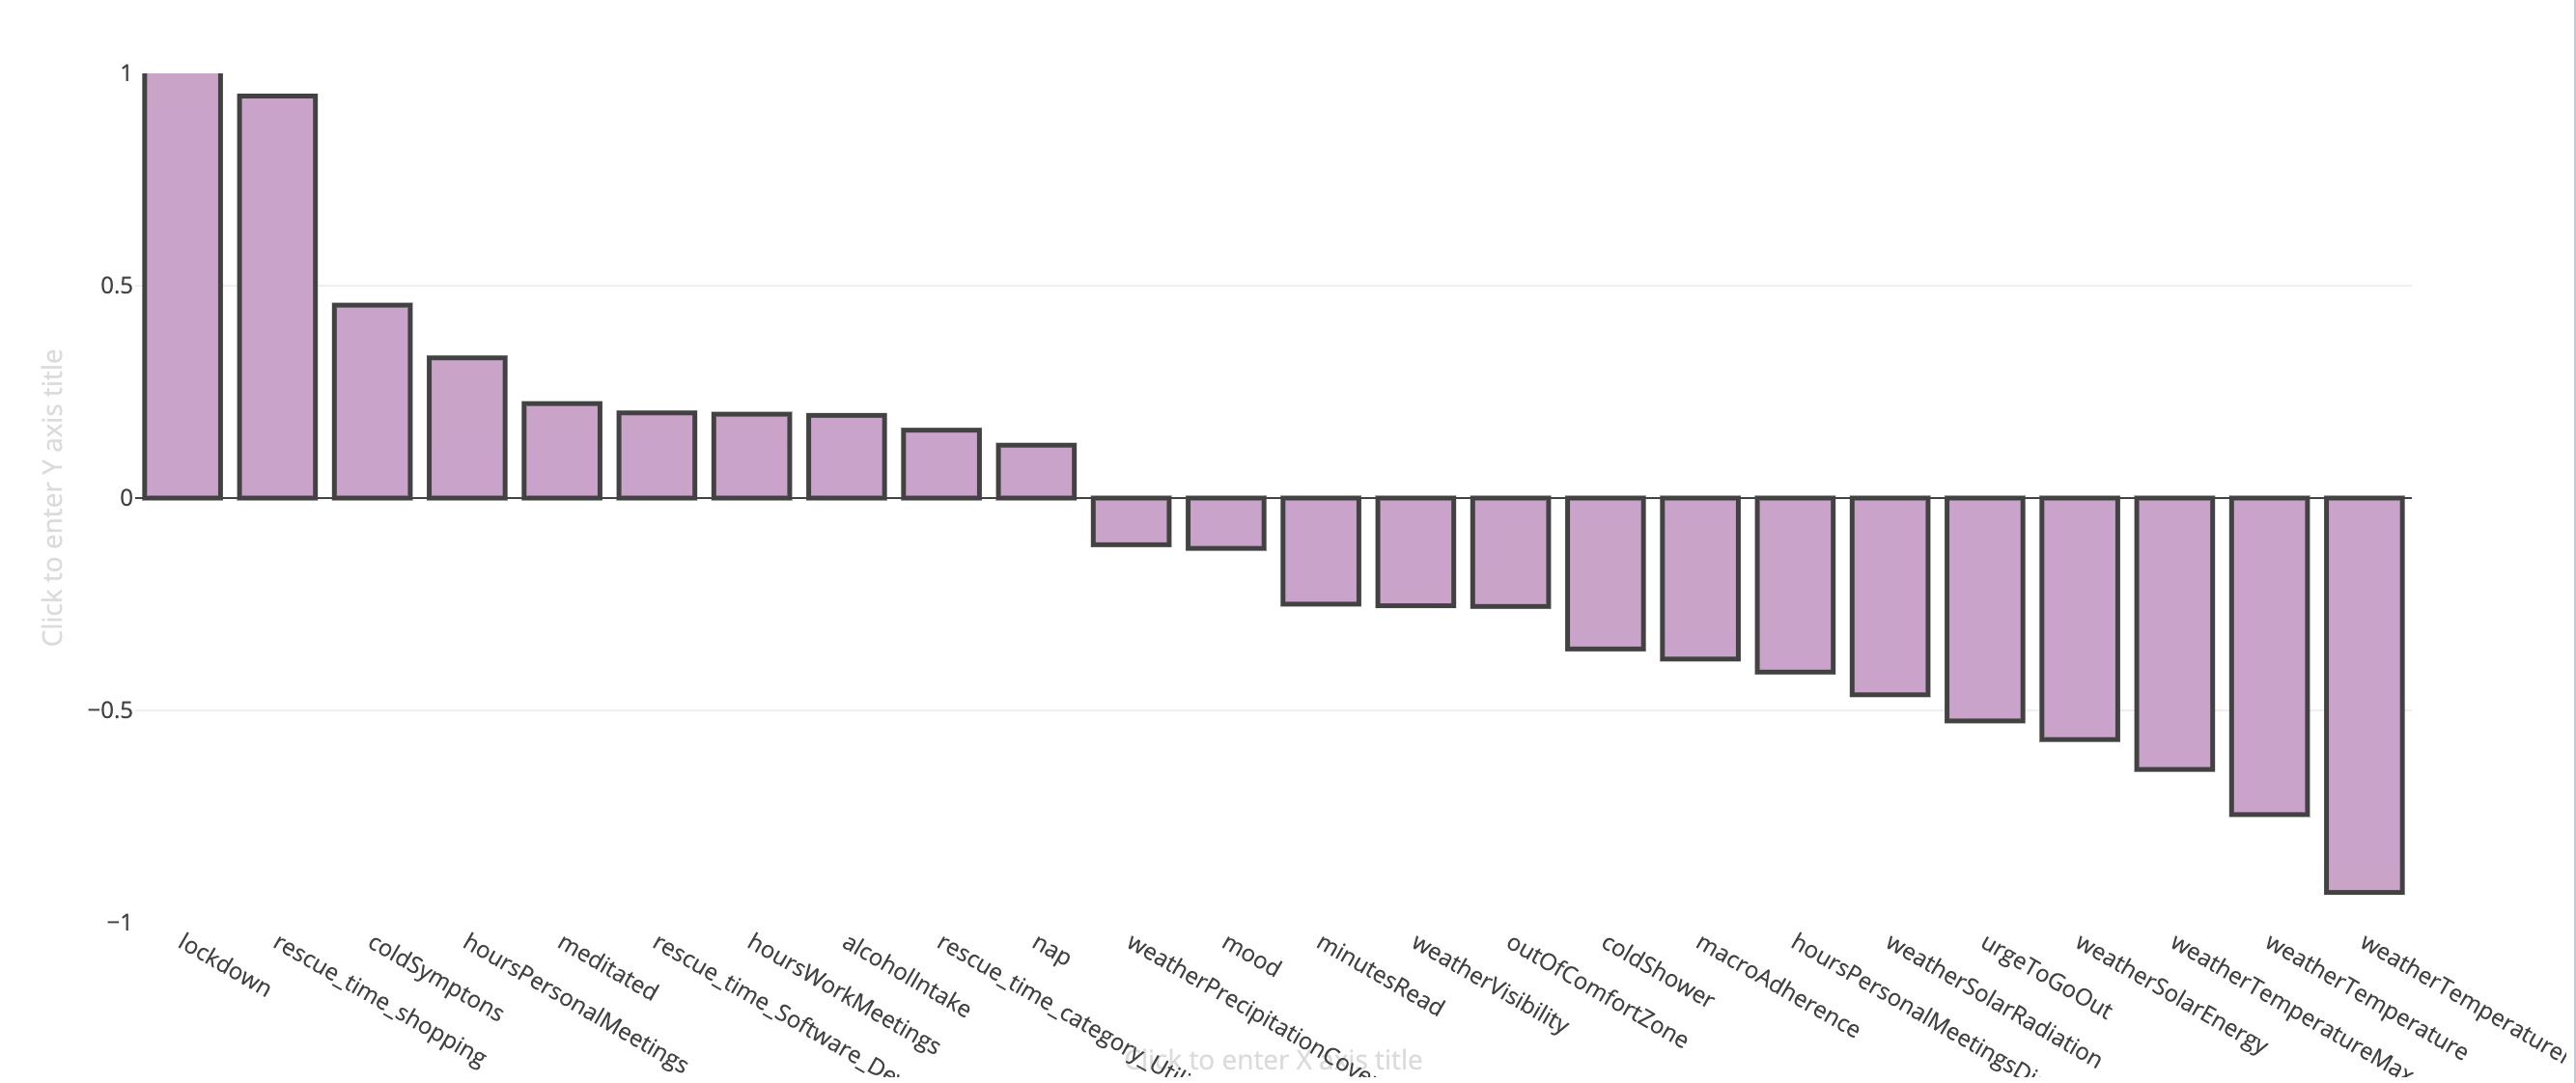
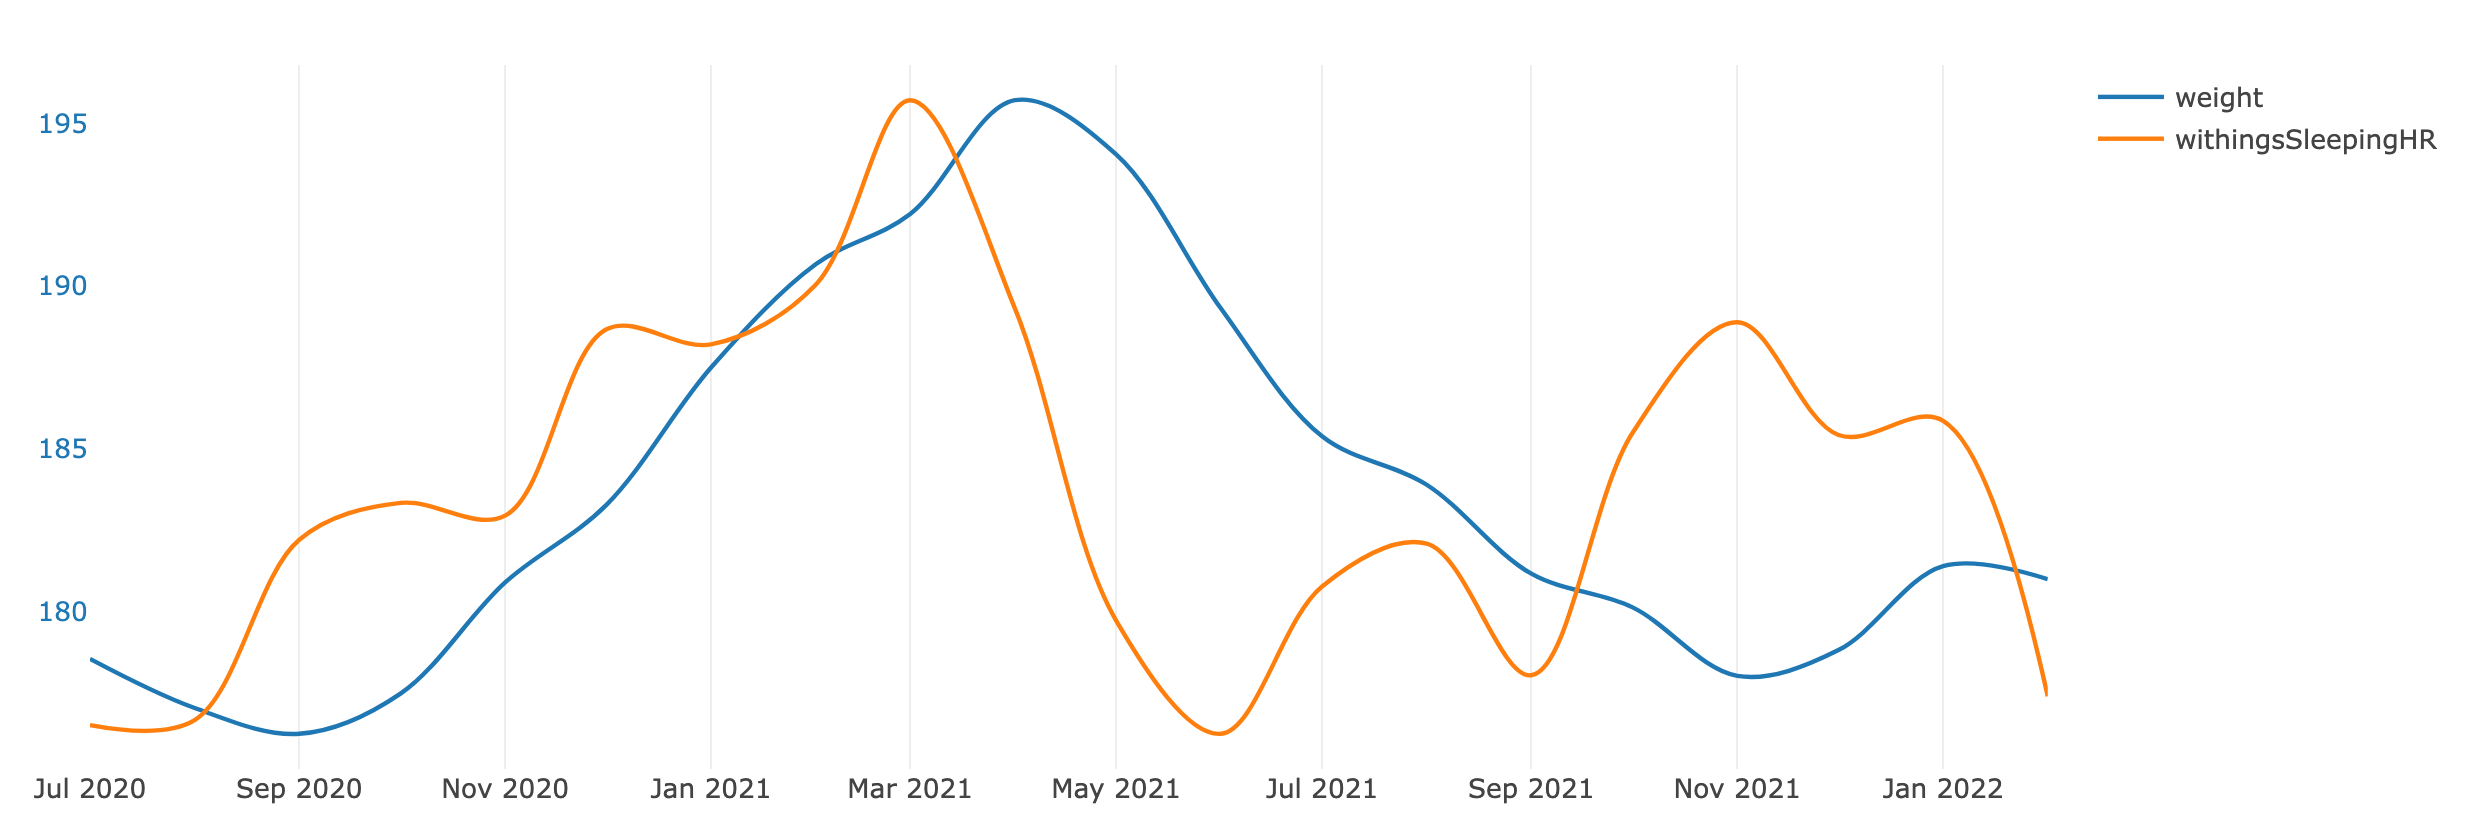 ### pie_chart.html
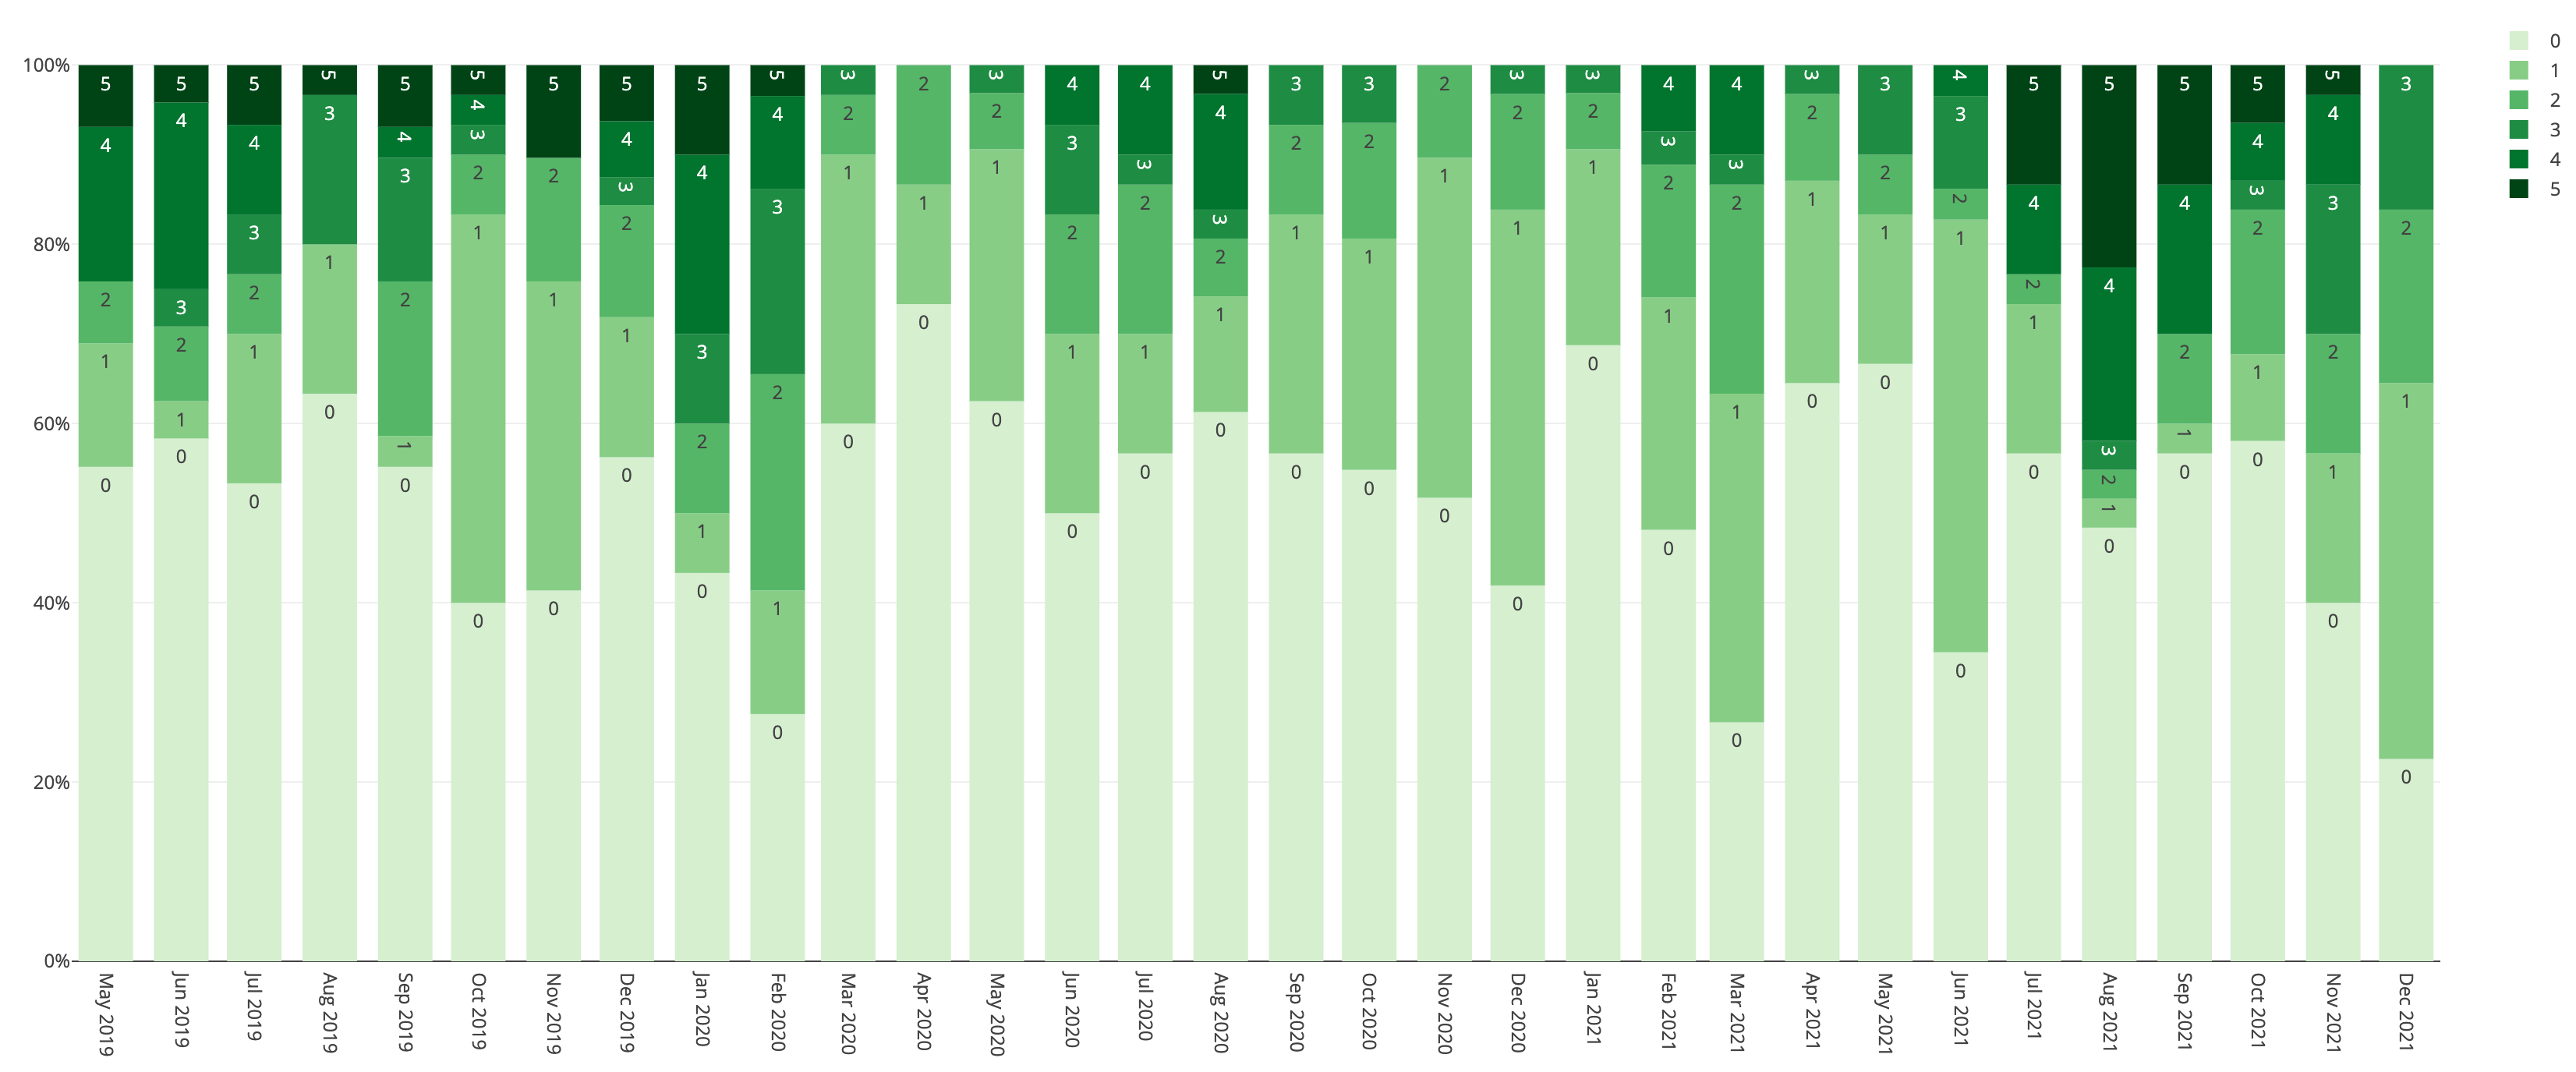
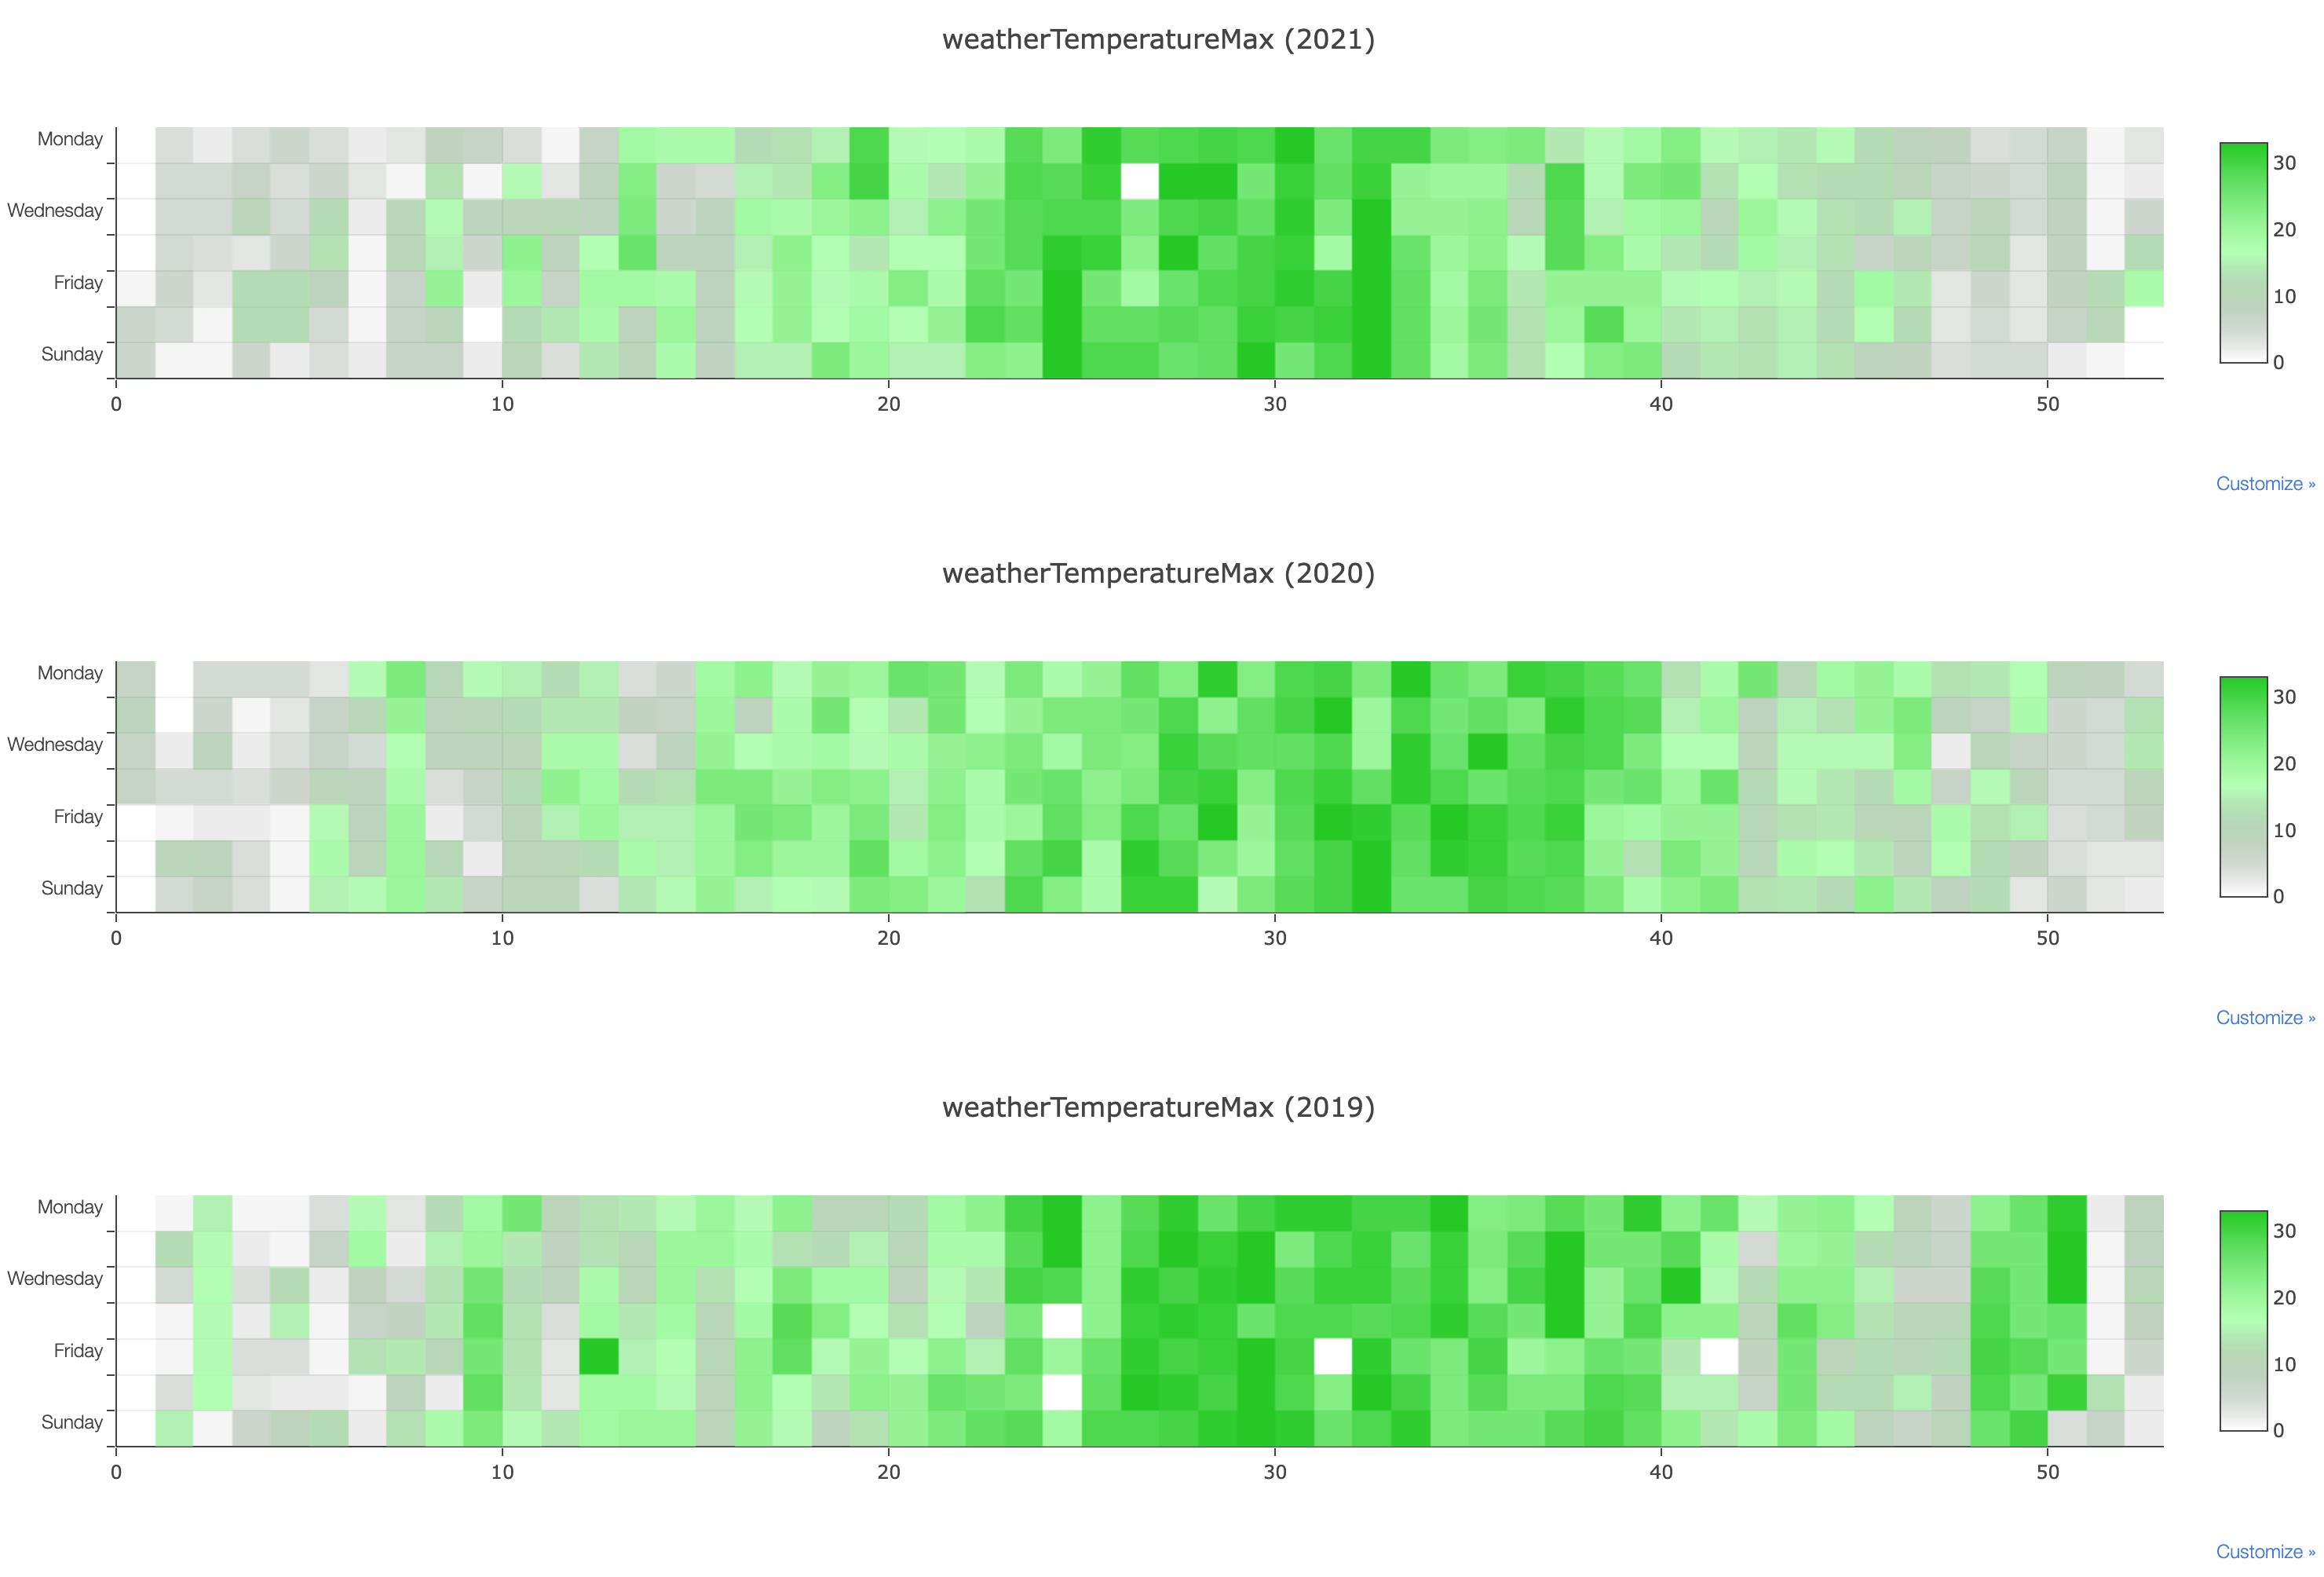
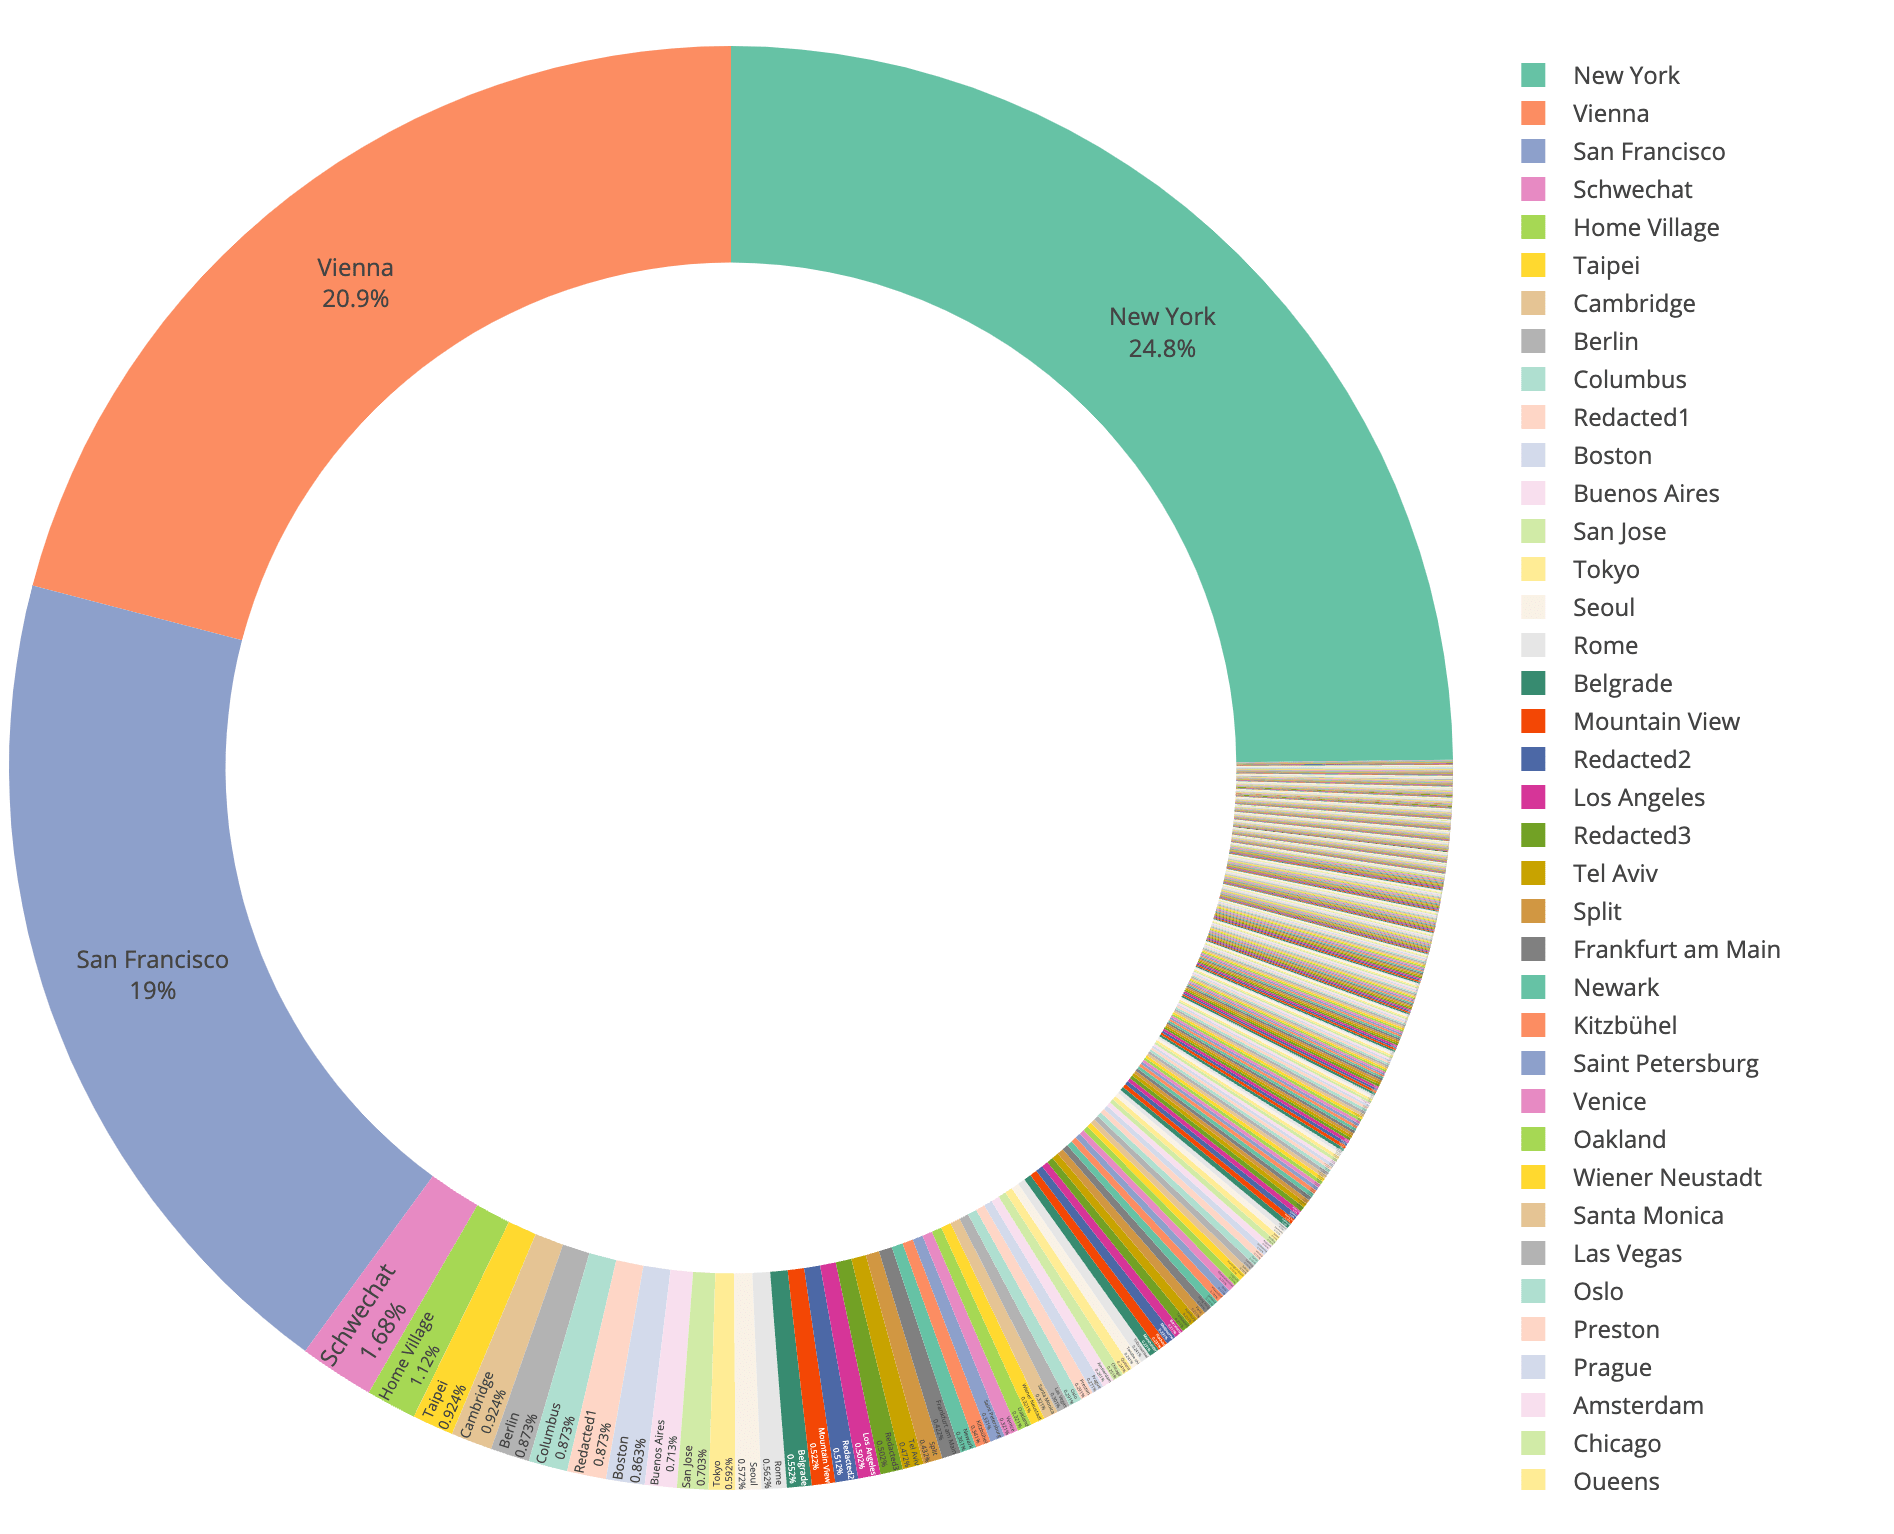 ### github_style.html
 ### test_map.html
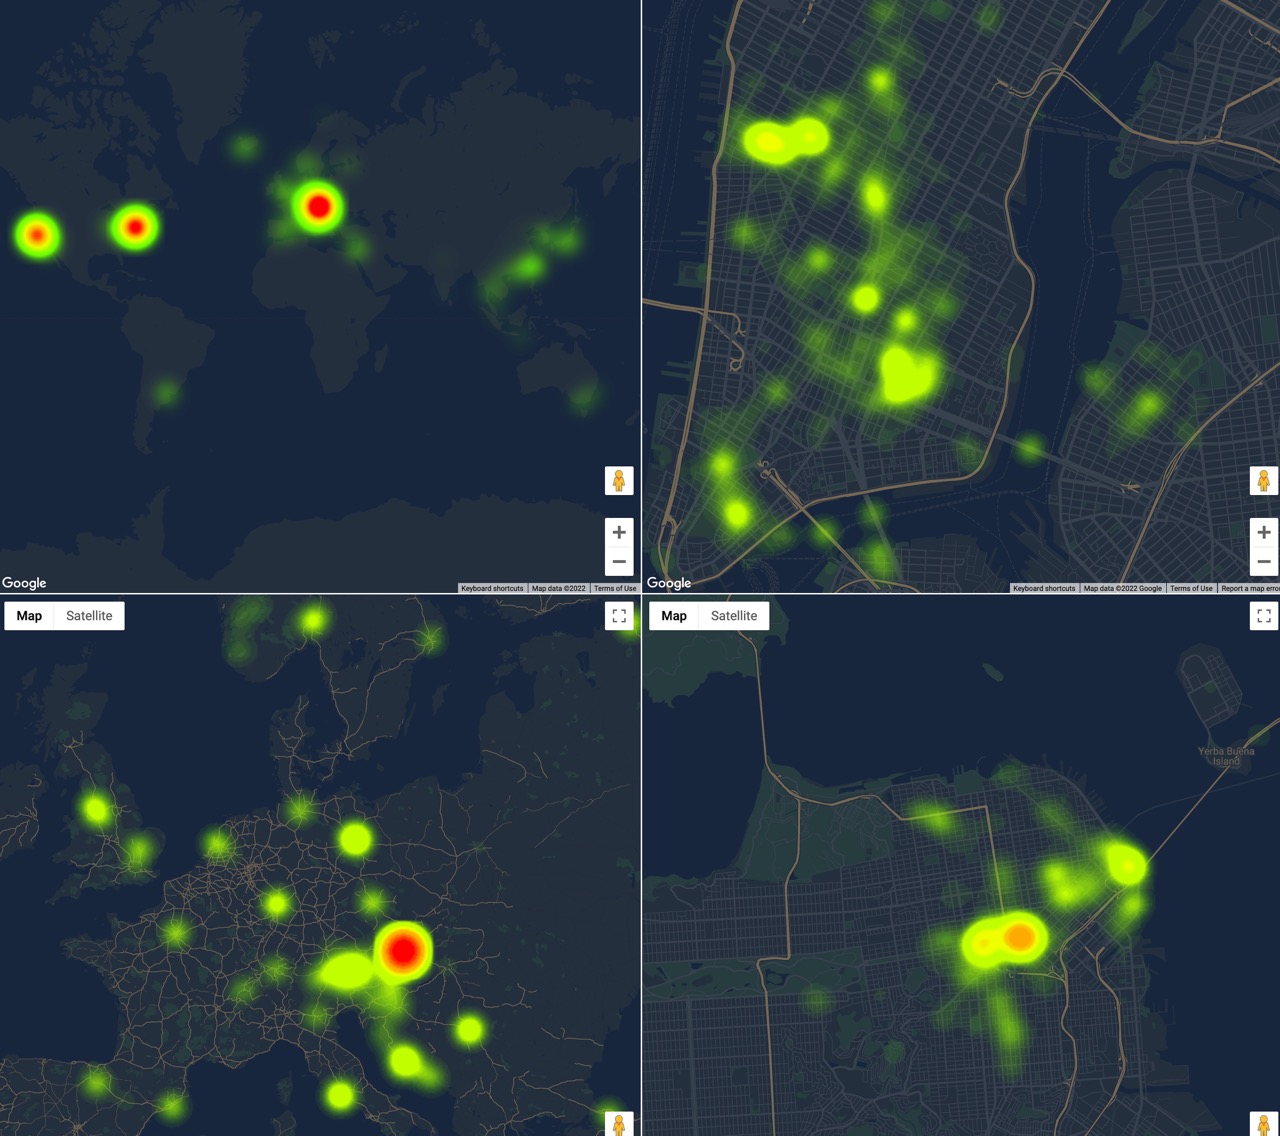
### test_map.html
